Lots of physical geography in the news this week:
Volcanic ash disrupts flights in Europe - BBC
Storm kills 130 in India, Nepal, and Bangladesh - BBC
More than 1,000 die in China quake - BBC
Friday, April 16, 2010
Cognitive Maps
Mind maps and concept maps (collectively referred to here as cognitive maps) can be useful tools for graphically communicating ideas, although they're not maps in the geographic sense because they don't portray real spatial relationships. They do share something in common with geographic maps, however, and that's the property of connectedness. Mind maps and concept maps connect ideas in the same way that subway maps connect metro stations and road maps connect cities and towns. It's the ability to visually display ideas and the relationships between them that make these tools so attractive.
Although strict definitions and rules exist for both mind maps and concept maps, I use both terms somewhat loosely. Generally speaking, a mind map is a graphical depiction of a central idea with subordinate ideas branching off in a radiating, tree-like hierarchy. Because of their hierarchical nature, mind maps are like visual outlines. Concept maps, on the other hand, can be more free-form, and are not necessarily focused on a single central idea.
I prefer concept maps and mind maps to text-based organizing systems like outlines for two reasons. First, they are inherently visual. Rather than presenting ideas in a unilinear flow of text down the page, cognitive maps connect ideas in a non-linear fashion using a variety of visual tools, like shapes, colors, and images. Second, these cognitive maps use actual lines to represent the connections between ideas. Outlines, on the other hand, represent the connections between ideas less graphically, usually through the use of indentation and numbering. Not only do mind maps and concept maps make these connections explicit, they also make it easy to visually connect ideas in different places across the page. The ability to identify connections is one of the goals of higher education, and the capacity to represent these connections is what makes cognitive maps so powerful.
Over the past several months, I've been experimenting with a number of free software packages and websites that allow you to create mind maps and concept maps. For mind maps, I prefer XMind because of its wide array of features and aesthetically pleasing themes. For concept mapping, I like Visual Understanding Environment (VUE), available from Tufts University. Its data exploration tools make analyzing the links between ideas particularly easy. Although XMind and VUE are free, they both require you to download software to your computer. If you're looking for a web-based application, try bubbl.us, which has a surprising number of features for a free web tool. Mind42, while not as visually pleasing as bubbl.us, does allow you to export your maps in the popular FreeMind format. Mind-mapping.org maintains a list of free web-based mind mapping applications.
Although strict definitions and rules exist for both mind maps and concept maps, I use both terms somewhat loosely. Generally speaking, a mind map is a graphical depiction of a central idea with subordinate ideas branching off in a radiating, tree-like hierarchy. Because of their hierarchical nature, mind maps are like visual outlines. Concept maps, on the other hand, can be more free-form, and are not necessarily focused on a single central idea.
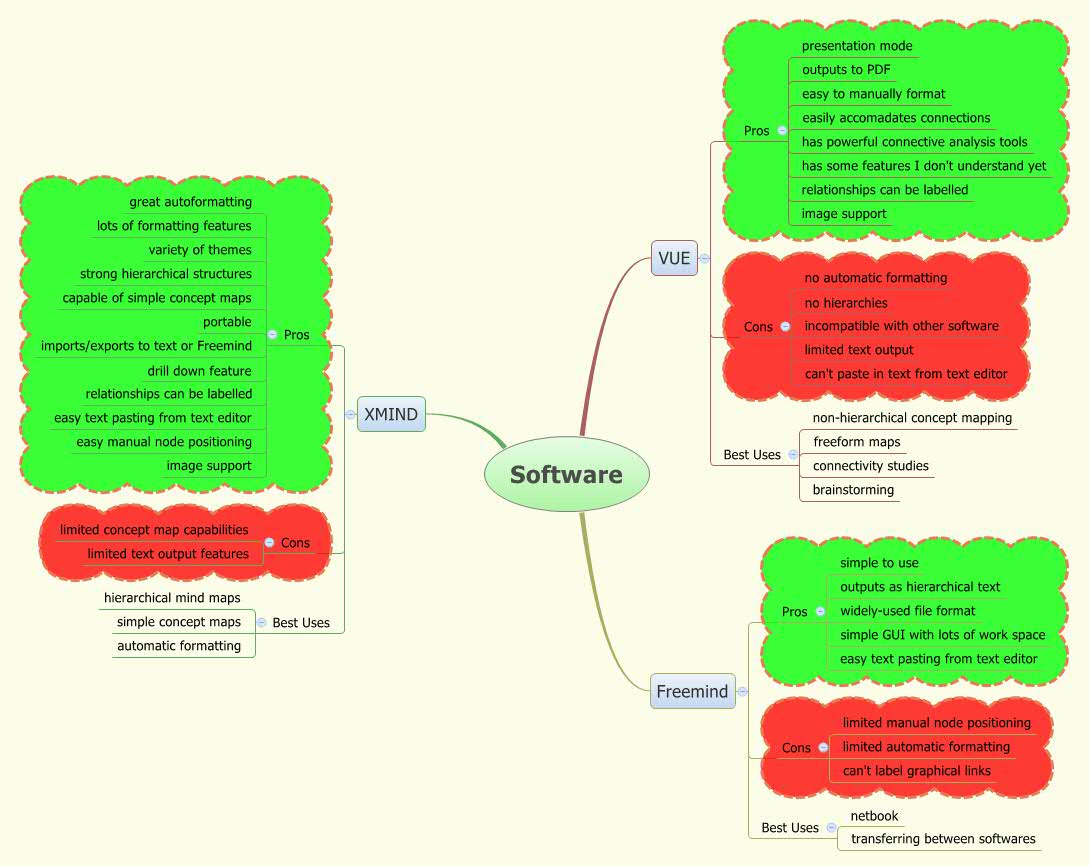 |
| An example of a mind map. |
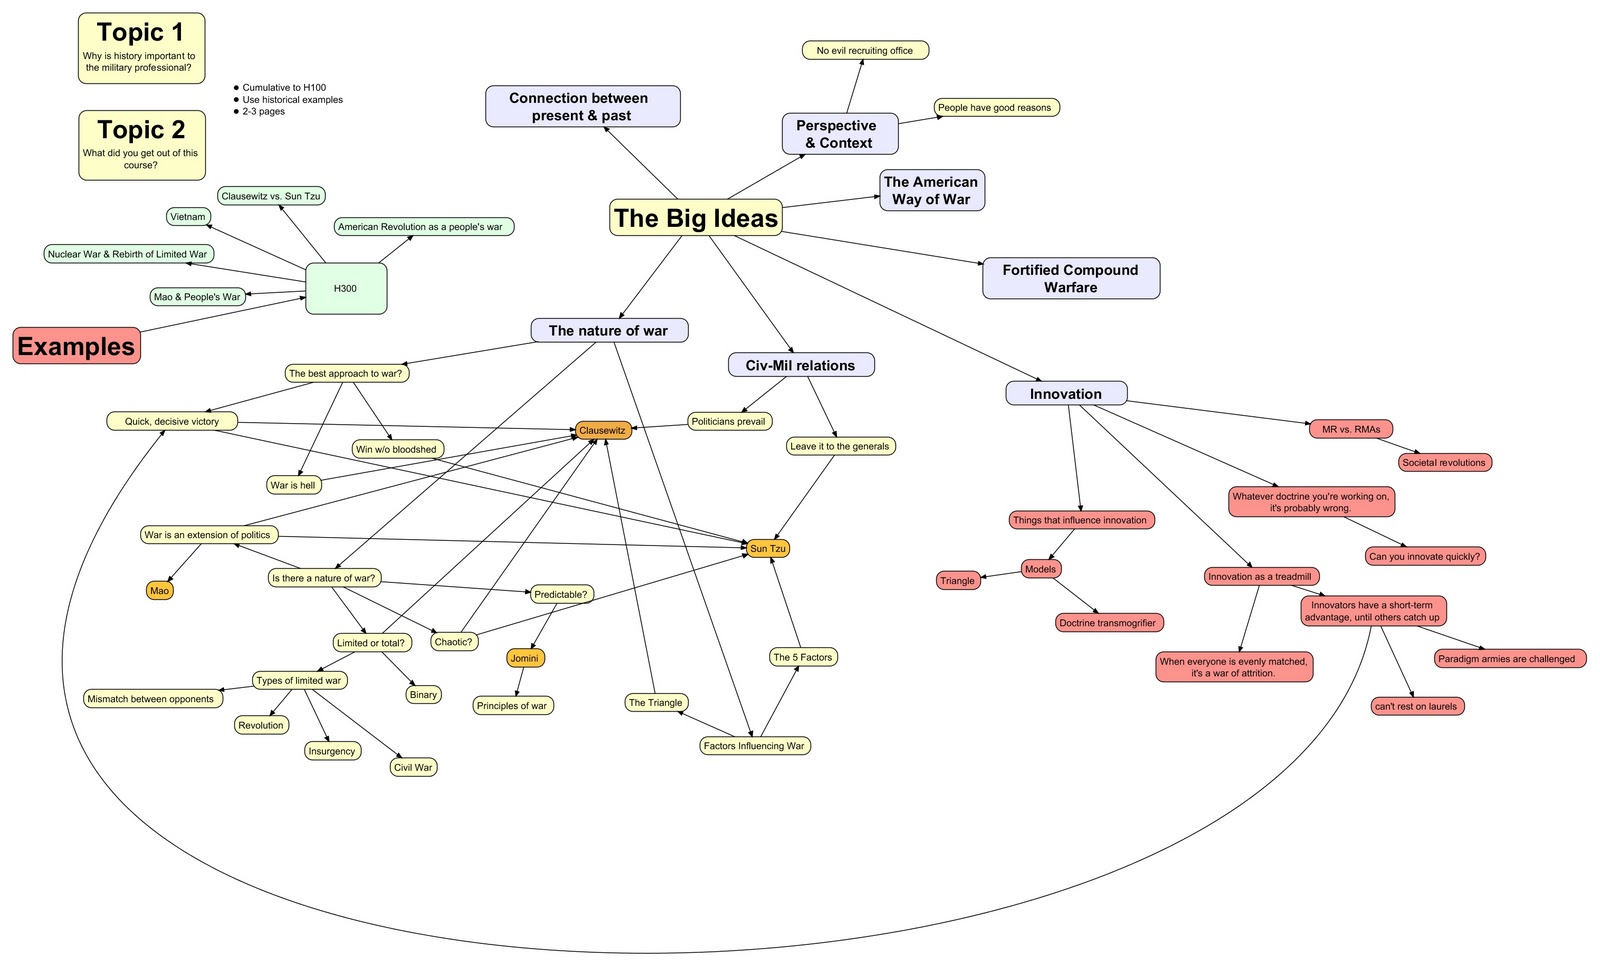 |
| An example of a concept map. |
I prefer concept maps and mind maps to text-based organizing systems like outlines for two reasons. First, they are inherently visual. Rather than presenting ideas in a unilinear flow of text down the page, cognitive maps connect ideas in a non-linear fashion using a variety of visual tools, like shapes, colors, and images. Second, these cognitive maps use actual lines to represent the connections between ideas. Outlines, on the other hand, represent the connections between ideas less graphically, usually through the use of indentation and numbering. Not only do mind maps and concept maps make these connections explicit, they also make it easy to visually connect ideas in different places across the page. The ability to identify connections is one of the goals of higher education, and the capacity to represent these connections is what makes cognitive maps so powerful.
Over the past several months, I've been experimenting with a number of free software packages and websites that allow you to create mind maps and concept maps. For mind maps, I prefer XMind because of its wide array of features and aesthetically pleasing themes. For concept mapping, I like Visual Understanding Environment (VUE), available from Tufts University. Its data exploration tools make analyzing the links between ideas particularly easy. Although XMind and VUE are free, they both require you to download software to your computer. If you're looking for a web-based application, try bubbl.us, which has a surprising number of features for a free web tool. Mind42, while not as visually pleasing as bubbl.us, does allow you to export your maps in the popular FreeMind format. Mind-mapping.org maintains a list of free web-based mind mapping applications.
Thursday, April 15, 2010
Bio Mapping
Artist Christian Nold has made some fascinating maps using a technique he calls bio mapping, in which participants walk through a city while wearing a device that simultaneously records Galvanic Skin Response (a measure of emotional arousal) and geographic location. Nold combines this data with annotations from the participants to map the emotional geography of a city. Check out, for instance, the Stockport Emotion Map, the East Paris Emotion Map, or the Brentford Biopsy.
Equally interesting is the Newham Sensory Deprivation Map. In this project, participants were divided into teams of two: one person received a GPS along with pencil and paper, while the other had his or her sight and hearing disabled by a blindfold and noise-cancelling headphones. The participants were then asked to walk around Newham Sixth Form College in London, recording the perceptions of the sensory-impaired person. The result is "an alternative sensory map" of the area.
Nold has also edited a book entitled Emotional Cartography: Technologies of the Self, available as a free PDF download on his site.
 | |||||||
| The Stockport Emotion Map. Used under the Creative Commons Attribution NonCommercial ShareAlike 2.5 License. |
Tuesday, April 13, 2010
Wal-Mart responds to the invisible green hand
Wal-Mart has been going green for profit, not altruism.
Wal-Mart chairman: Go green for money, not image | Green Tech - CNET News
Wal-Mart chairman: Go green for money, not image | Green Tech - CNET News
Monday, April 12, 2010
Subscribe to:
Posts (Atom)